-
Type:
Story
-
Status: Closed (View Workflow)
-
Resolution: Done
-
Affects Version/s: None
-
Fix Version/s: None
-
Component/s: None
-
Labels:None
-
Sprint:CFAMX 2020R4 SA Sprint 3, CFAMX 2020R4 SA Sprint 4
-
SCRUM Team:Globogym Purple Cobras
-
Story Points:2
-
SOW (Time Tracking) Project:45076
-
Work Type Classification:Sustaining
Story
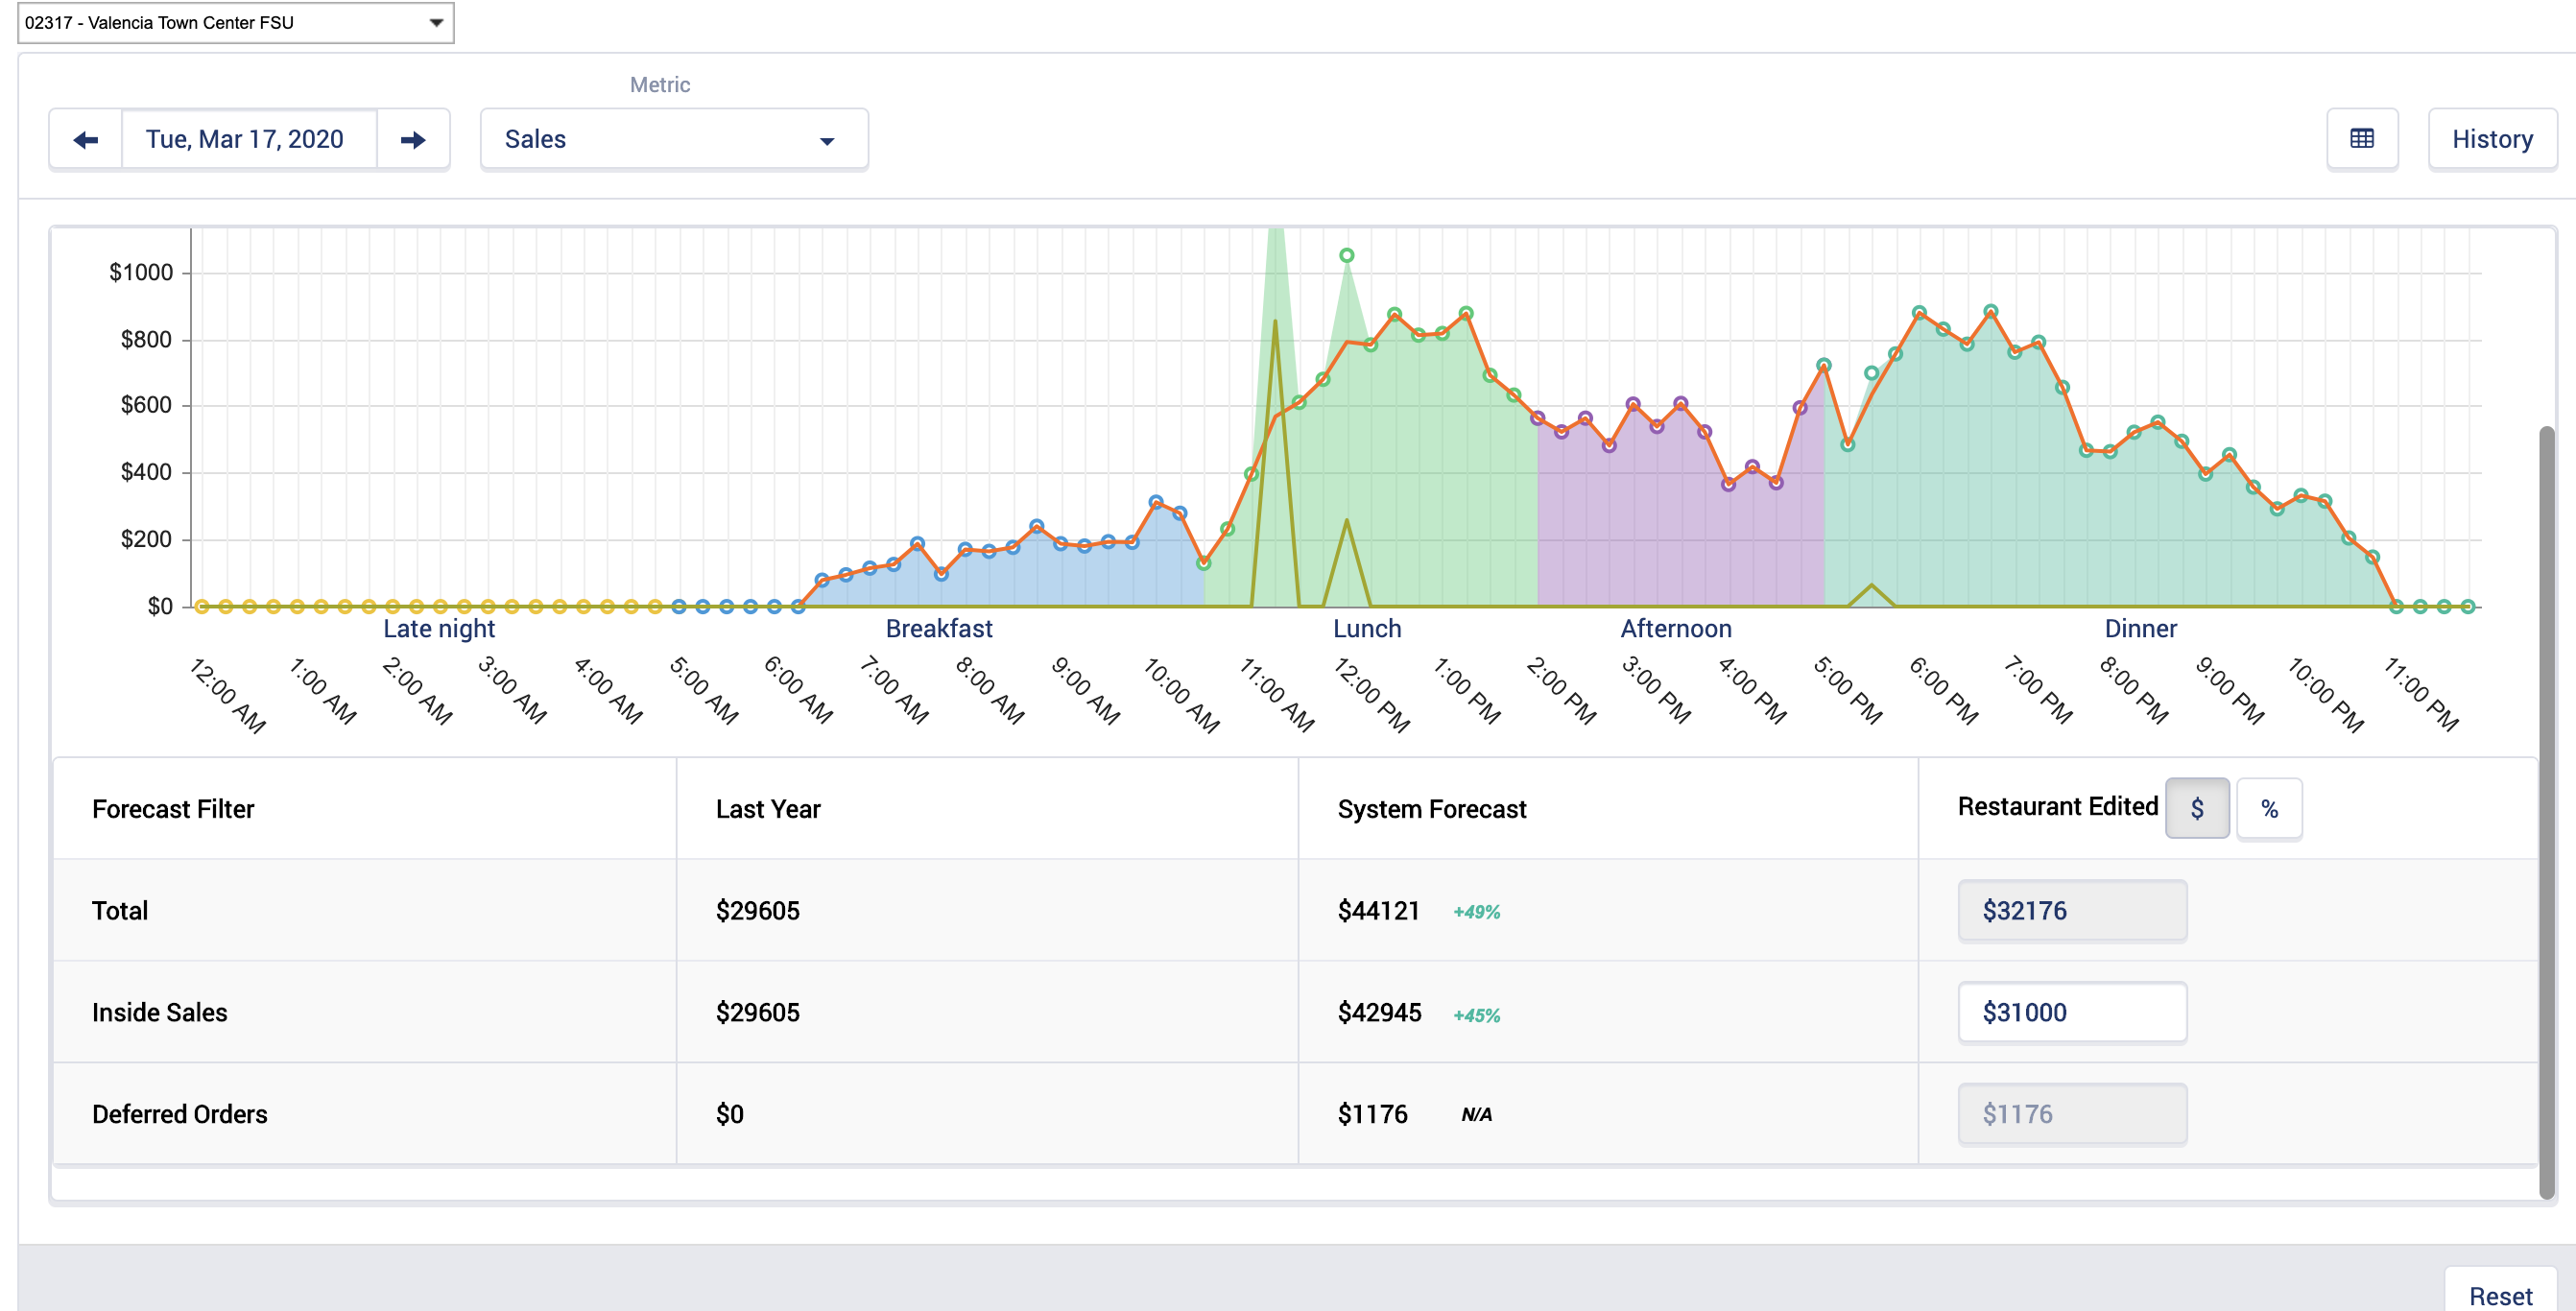
- When I view all types of forecast graphs, I would like to be presented with a percentage of change between Last Year’s actuals and the system generated forecast. This will help me to get a quick overview of the difference between these metrics.
Design
UAC
- In all Forecasting pages;
- Sales
- Transactions
- Sales Items
- include a calculation for the percentage of change between the System Forecasted value and Last Year’s actuals.
- The equation for this value is: ((Forecast - Actual) / Actual) * 100)
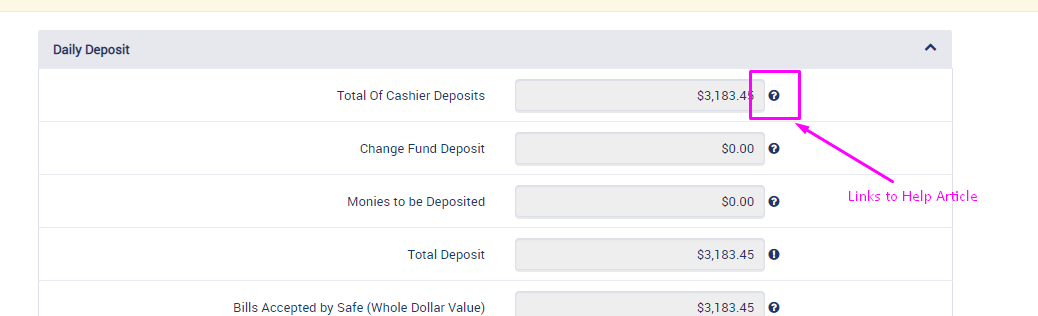
- An info icon is included in the “System Forecast” metric header. When the user hovers over this icon
 they are given details about how the percentage is calculated including the formula.
- Info Icon Text: "The percentage below is calculated using the following formula: ((System Forecast - Last Year) / Last Year) * 100)"


- implements
-
CFAMX-10259 INF-12207 Add Percentages to Forecast Graph
-

- Closed
-
- is related to
-
 CFAMX-11081
2020.R4(S2): Forecast Percentage - System Forecast Help Icon cannot be tied to Article
CFAMX-11081
2020.R4(S2): Forecast Percentage - System Forecast Help Icon cannot be tied to Article
-

- Done
-
1.
|
Review Test Scripts |
|
Done | Soma Dixon (Inactive) |
|
||||||||
2.
|
Deploy |
|
Done | Unassigned |
|
||||||||
3.
|
Functional Review with QA |
|
Done | Francois Steenkamp (Inactive) |
|
||||||||
4.
|
DIT |
|
Done | Francois Steenkamp (Inactive) |
|
||||||||
5.
|
Update UI template and controller |
|
Done | Francois Steenkamp (Inactive) |
|
||||||||
6.
|
Create Test Cases |
|
Done | Gareth Leibbrandt (Inactive) |
|
||||||||
7.
|
Execute Test Cases |
|
Done | Gareth Leibbrandt (Inactive) |
|
